For most dimensions, when we report on totals, the sum of our lines is expected to be identical to the total.
For example, if we are looking at the cost of inventory at each shop:
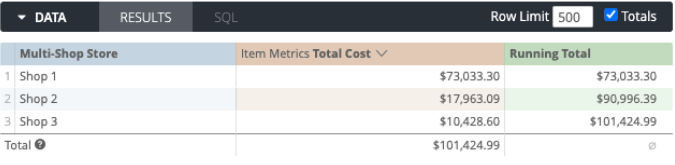
We see that the last line of the running total is equal to the store total cost.
This should be expected for most dimensions: stores, categories, vendors, customers, months, etc.
But what about tags?
If we were to report on identical data, but by tag:
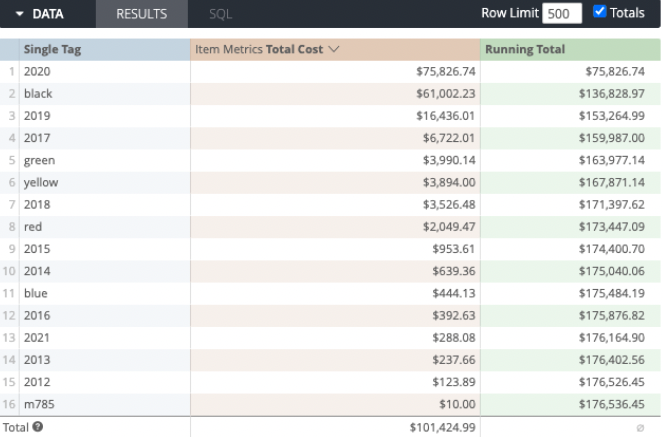
We actually see quite a significant variance between the store total and the running total.
Why is this?
Multiple tags can be applied to the same product, causing tags to behave a bit differently as a dimension.
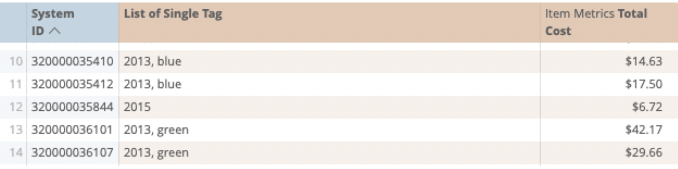
If we look at a handful of system IDs with their tags listed, we see the cost for each item:
But if we look at the same items, listing tags as a dimension, two things happen:
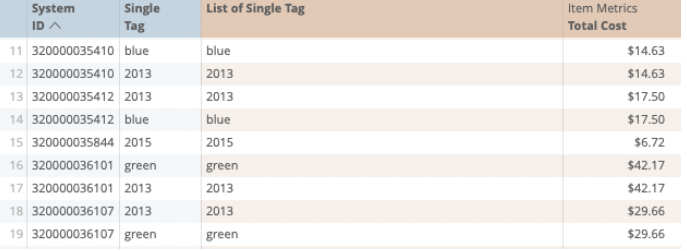
- First, we'll get a separate line for each tag
- Second, we'll see the same cost for each item.
Now each cost is correct, but due to the multiple tags, this does not mean that each cost is a new cost.
For example, for the first item, the $14.63 cost of the blue tag and the $14.63 cost of the 2013 tag are not supposed to be added. They are the same item and the same cost.
For this reason, and others, we need to be careful in how we use and interpret data where tags are present. Tags can be very helpful in designing precise reports that follow your custom data conventions. Tags can give you a lot of insight where standard data is not available, but tags follow a different set of rules. Knowing these rules will give you more insight, more freedom to build, and more confidence in the reports that you have built.