The Customer Lifetime Value report allows you to compare customer shopping habits and other important data. Among the data points that can be found in this report, you can see historic and recent activity in your store and compare customer shopping habits with other customers. You can also build comparisons to whether the recent activity is consistent with historic activity, and whether it is increasing in volume or slowing down.
Here are some of the data points that can be surfaced to build rich analyses about your customers' activity.
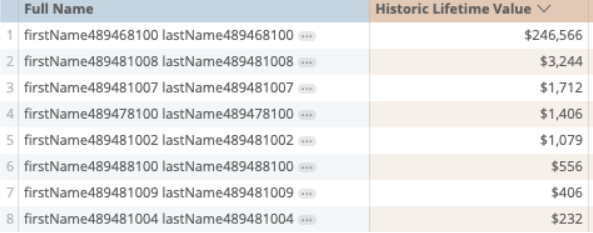
Historic Lifetime Value (Measure)
Summed Sale Line subtotals

Very simply, this is the complete subtotal of all the customer's identified purchases in your store.
Historic Lifetime Value (Filter)
Summed Sale Line subtotals

Similar to the above measure, the Historic Lifetime Value can also be applied to a report as a filter.
For example, if you wish to identify only customers that have spent more than $10,000 in your store, or, if you wish to identify only customers that have spent less than $1,000 in the store, this is how you can proceed.
Average Lifetime Value (Measure)
Average Lifetime Value among all customers

When applied to the individual customer, the Average Lifetime Value is identical to the Historic Lifetime Value.
When applied to a grouping of customers, the Average Lifetime Value is calculated as follows:
Average Lifetime value = sum of customers' Historic Lifetime Value/Number of customers
Sum of all customers' Historic Lifetime Value / Number of Customers
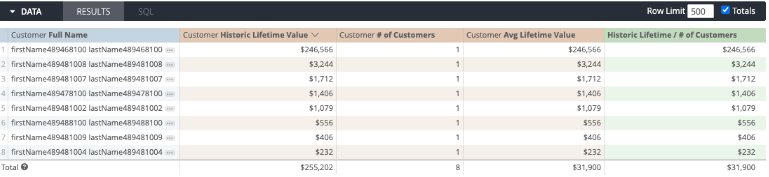
Sales Total
Total revenue of that grouping

When looking at the Historic Lifetime Value, we can also isolate sales activity from a certain time frame on the same report.
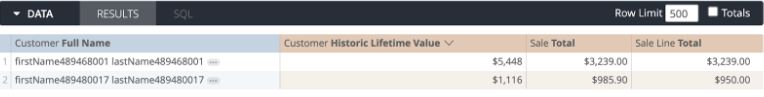
If we were to add the Sale Total next to the Historic Lifetime Value, we'd see that they are essentially the same:
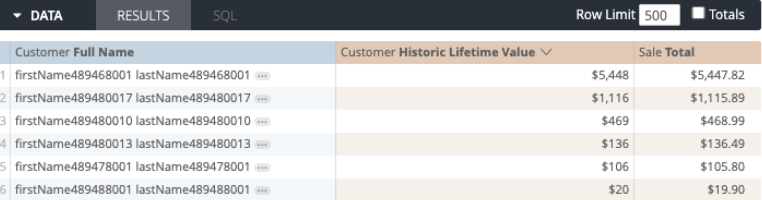
Note: HLV is rounded to a whole number and that Sale Total is two decimals.
You can also filter this report to limit the date of Sales considered.
Let's see what happens when we apply a filter for the Sales Date:

We'll see that two things have happened:
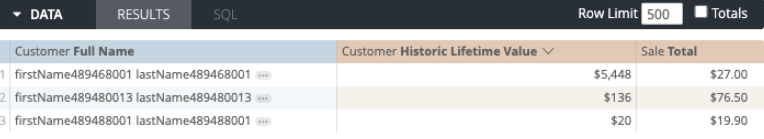
First, the Historic Lifetime Value has been kept, but the Sale Total now is only that which corresponds to the defined Sales Date range.
And secondly, customers with no sales during this timeframe were not included in the report.
Sale Line Total
Summed revenue of all lines on the sale with no tax

Similar to the above, the Sale Line Total, with no filters, will result in identical values as Historic Lifetime Value and Sale Total.
You will see that the Total and Sale Line Total are equal to each other, but different from the Historic Lifetime Value.
You can also filter this report on the Item:

Let's say, that we are only interested in sales that were for items in the BIKES category:
We'll see now that a few things have happened.
First, the sales which did not include bikes are not included. This removes some sales it removes some customers.
Secondly, we'll see the variance between the three numbers now:
- The Historic Lifetime Value represents all sales
- The Sale Total represents the total of Sales where BIKES were present
- The Sale Line Total represents the total of the BIKES items