Average Basket Value is a common measure in many kinds of reports. It shows the average amount spent per sale. Typically it follows a predictable formula: total sales divided by number of sales.
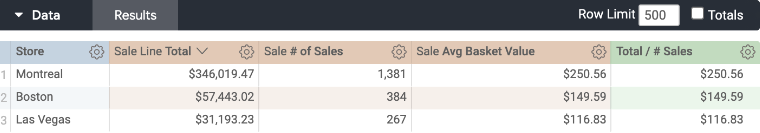
If using this calculation against Average Basket Value by Store:
Or by Month:
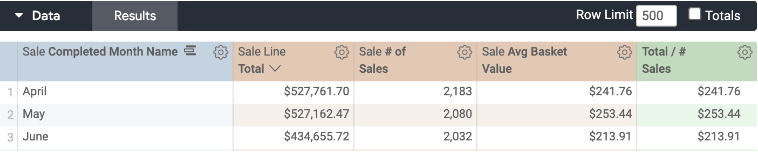
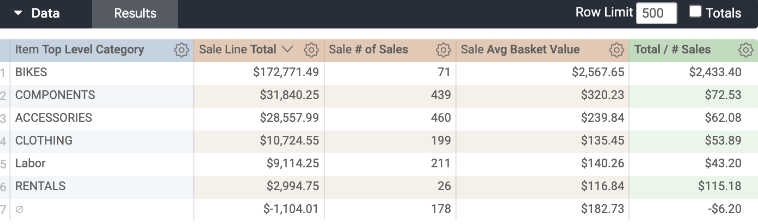
We find that the calculation holds. However, what happens if we try using Average Basket Value by Category?
Or by Brand?
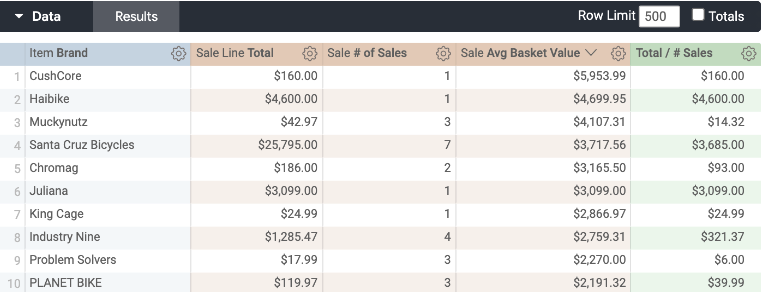
There's a lot of variance between the Average Basket Value and the Calculation of Sales Total divided by number of Sales. So what is the reason for this variance?
Let's look for a sale that has multiple Items on it. I'm going to filter the report to just one sale and add the Categories as Dimensions on the report:
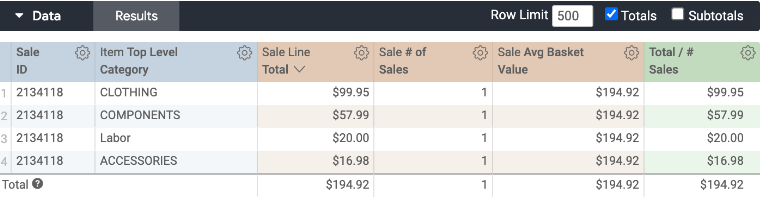
Look what numbers are returned.
The calculation is the Sale Line divided by the number of Sales. In this case, the totals and calculation are identical because we are dividing by 1.
But the Average Basket Value returns the value of the whole sale.
This is because Average Basket Value is a function of the whole sale that an item was on, not just the value of the item itself.
For this reason, we can actually leverage some interesting analyses.
Say, for example, that we want to measure the upsell value in addition to a bike on a sale:
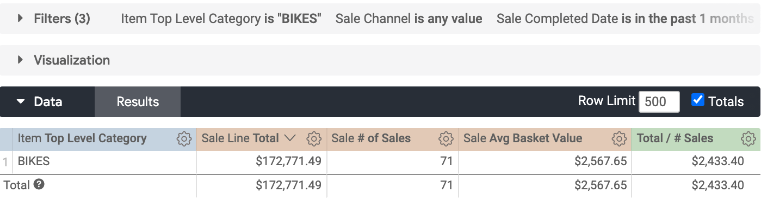
With our calculation, we can illustrate the average bike value on these sales. If we subtract this from the Average Basket Value:
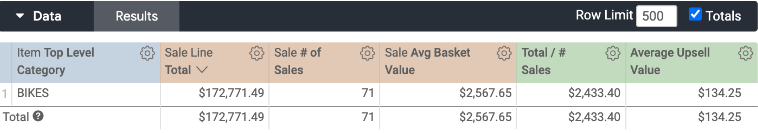
We can also measure the Average Upsell Value too!
So, Average Basket Value should align identically when sales are not split by Store, by Day, by Register, etc. But they are not expected to align identically when they are split by Item, by Brand, or by Discount.