Pivoting data is a way of reporting on two major dimensions at once, by turning a list of results into a table of results.
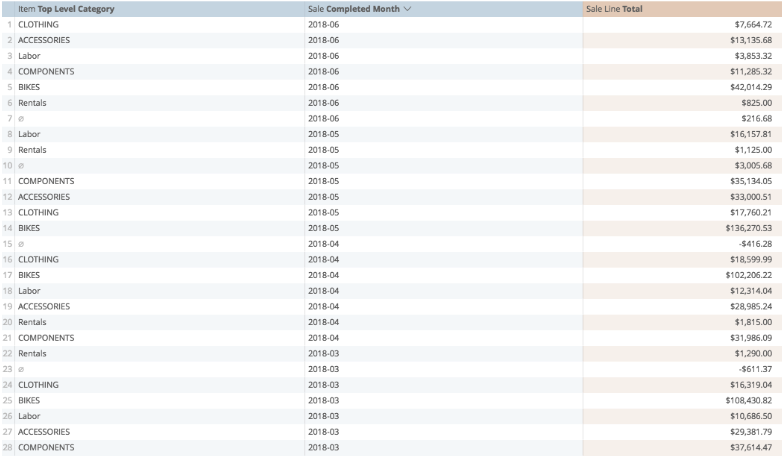
In this example, there are two dimensions of sales from the past four months — the first dimension being Top Level Category, and the second dimension being Completed Month.
When we add two dimensions, it creates a list of data:

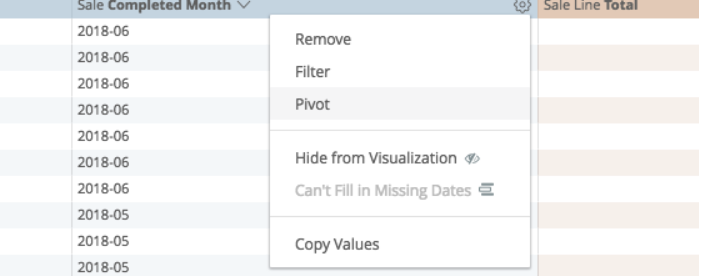
But when we pivot on the Completed Month and then run again:

The results are displayed on a much clearer table:

Our data is identical, but it is easier to read quickly.
On the Data tab, we can also now select checkboxes for Totals (Column totals) and Row Totals:

This adds space onto our table for totals:

And when we run again, we get summary results to measure categories, months, and the overall total:

The most common kinds of pivots are reading results over time, day-over-day, month-over-month, year-over-year (as in the example above), and looking at sales or inventory activity in Multi-Store environments.

Just like dimensions, we can add two layers of dimensions to pivots:

Calculations can respond to pivoted dimensions, just as non-pivoted dimensions. Say, for example, I want to highlight results from just one store, I would prepare it no differently than I would any other calculation:

In this instance, my calculation looks like this:
if(${shops.name}="name82373","We Love Disco",null)
If I have saved it properly:

Similarly, I can prepare compound IF statements looking at either pivoted or non-pivoted dimensions:

So in this instance, my calculation looks like this:
if(${shops.name}="name82373","We Love Disco",if(${cl_category_tops.top_level_category}="CLOTHING","Time for Cookies",null))
If I have saved it properly:

Just like regular dimensions and measures, pivoted measures have a special set of functions too.