This article contains some of the functions that you can add to reports with pivoting.
Lookup
Lookup is a way of identifying where certain content on your table may be and returning predefined results where it occurs. It requires three arguments: what you are looking for, what field you are looking in for it, and what to return if you find it.
For example, someone comes to your store saying that it was their birthday yesterday. They're preparing their thank-you cards now, but they don't remember who gave them what. A friend of theirs bought them a gift that cost $17.57 from your store, but they lost the receipt. They didn't know which friend of theirs it was, and they weren't sure from which location it was purchased.
So, you could start a table using a dimension of customer, pivoting a dimension of multi-shop store location, and using a measure of sales total:

Then for the lookup function, look up the number 17.57:

For the second argument, ask it to look at the sale lines total:

Then, for the third argument, look for the customer's full name:

So the calculation looks like this:
lookup(17.57,${sale_lines.total_sales_no_tax},${customers.full_name})
If prepared properly, here is the result:

It's finding a match to a customer in the third store.
You could perhaps create a copy of the calculation, but instead of asking it to show the customer, you could ask it to show which row it's on:

It's found a match in row 151.
Pivot column
Pivot column returns the number of the column, ascending from left to right and requires no arguments.

The calculation looks like this:
pivot_column()
If prepared properly, here is the result:

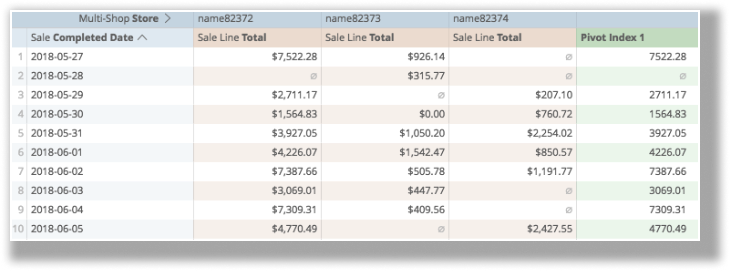
Pivot index
Pivot index is positioned at the far right of your table and returns content from column X. It requires 2 arguments, which dimension or measure you wish to look at, and at how many columns into your pivoted results.
For example:

The calculation looks like this:
pivot_index(${sale_lines.total_sales_no_tax},1)
If prepared properly, here is the result:

Pivot offset
Pivot offset returns the from x columns to the right. It requires two arguments: which dimension or measure you wish to look at, and how many columns to the right you want to look at. It returns null when the table runs out of columns.
For example:

In this instance the calculation looks like this:
pivot_offset(${sale_lines.total_sales_no_tax},1)
If prepared properly, here is the result:

Pivot offset list
Pivot offset list creates a list of values in the same row and requires three arguments: which measure you wish to look at, at how many rows to the right you wish to start the list, and how many rows to the right you wish to include on the list.
For example:

In this instance, the calculation looks like this:
pivot_offset_list(${sale_lines.total_sales_no_tax},0,3)
If prepared properly, the result is this:

Pivot where
Pivot where returns to the row and totals the results from a pivoted column where criteria about its dimension are met.
It requires two arguments: the logical test and the desired column to return.
For example:

In this instance, the function looks like this:
pivot_where(${sales.time_stamp_quarter_of_year}="Q2",${sale_lines.total_sales_no_tax})
If the calculation is prepared properly, this is the result:
