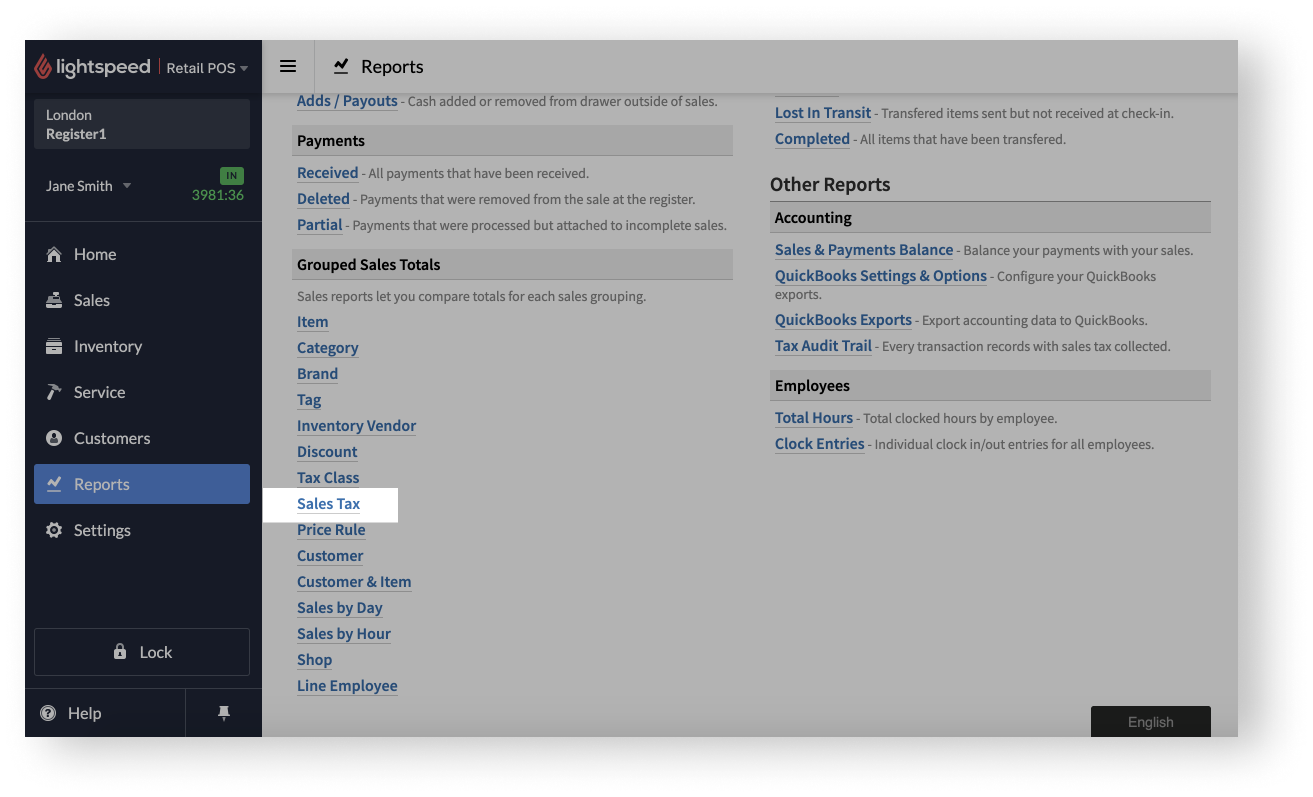
Under Grouped Sales Totals, the Sales Tax report allows you to view your taxes by sale tax. This is helpful if you want to see how much tax each sales tax in your account collected over a specific date range. If you have multiple shops and each of them has its own sales tax, this report is especially helpful as it can help you determine how much you need to remit to each shop's respective government.

To control which sales taxes are included in the report, use the available filters at the top of the report and click Search. The sales taxes will display as search results in the report.

Under the filters, you can control how many results you see per page (1-100).
At the top-right of the results, you can either Print or Export the report. Printing the report allows you to either review it on paper or save it as a PDF for future reference. Exporting the report as a CSV file allows you to customize it further in a spreadsheet software or share it with your accountant.
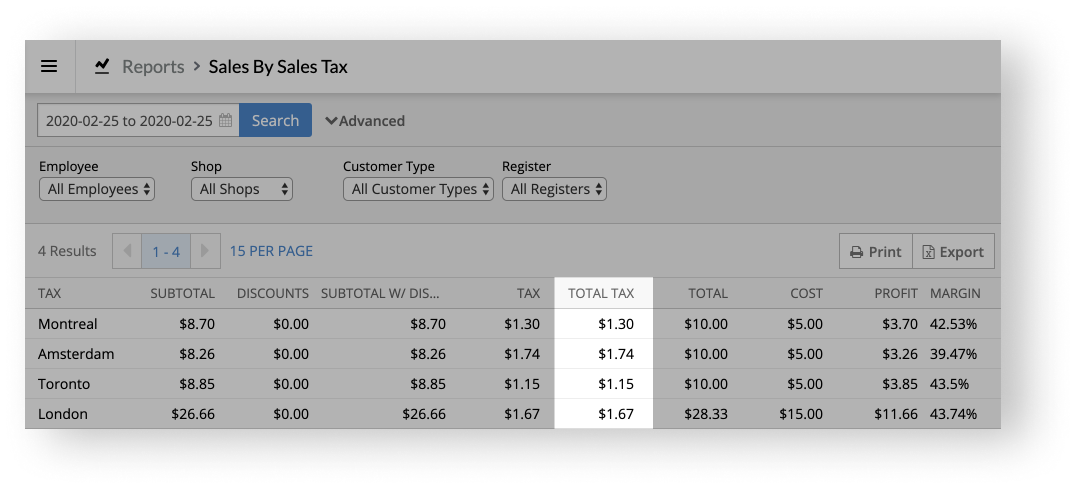
Once you decide which sales taxes you want to include in the report, you can see the total tax that each sales tax collected under the TOTAL TAX column.

Differences between single and dual tax structures
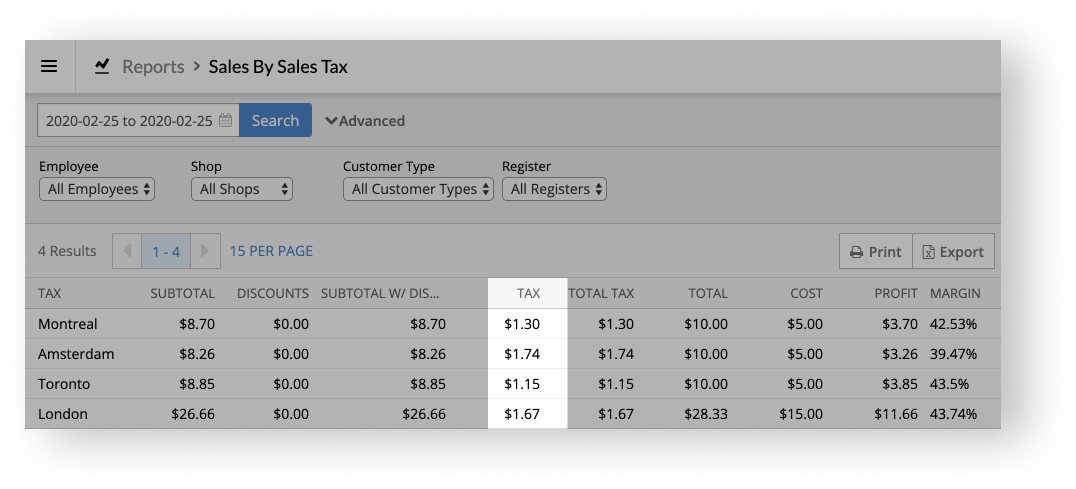
If you account uses a single tax structure, the report has a TAX column to the left of the TOTAL TAX column. The value under the TAX column is the same as the one under the TOTAL TAX column. This is expected as the report recognizes that the account is using a single tax structure.

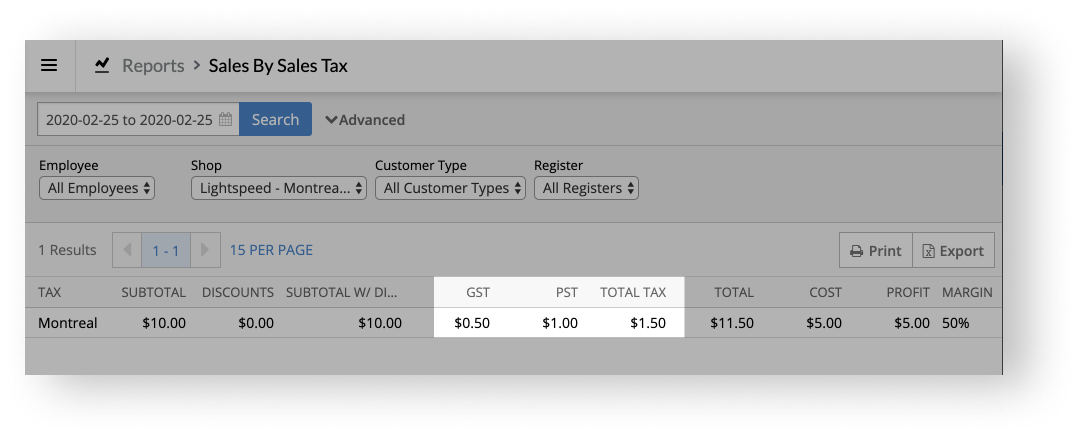
If your account uses a dual tax structure (e.g. GST and PST), however, you have two tax columns (e.g. GST and PST) to the left of the TOTAL TAX column. The value under the TOTAL TAX column is the sum of the values under the two tax columns. For example, in the image below, the TOTAL TAX column is the sum of the GST and PST columns.
